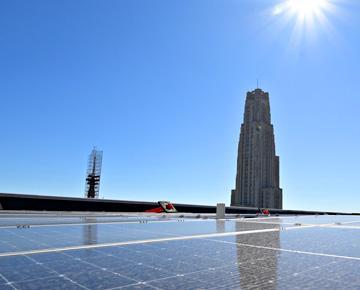
Pitt Sustainability Dashboard
The growing number of Pitt Sustainability Dashboards below provide interactive views of progress on select Pitt Sustainability Plan‘s goals. Overall, the Pitt Sustainability Dashboard strengthens transparency, advances analytic capabilities, and helps quantify the University’s impact as a global sustainability leader.
The 5 dashboards below focus on key performance indicators in the Stewardship and Food Systems areas of the Pitt Sustainability Plan, including greenhouse gas emissions, building energy and water use intensity, compostable collection, food recovery, and Real Food Challenge achievements. Interactive features allow you to view results at both building and campus scales for the Pittsburgh campus, while simultaneously selecting variable time frames through which to review data and results.
Check back as we launch additional datasets that will highlight our strategic progress across all 15 impact areas of the Pitt Sustainability Plan.
![]() |
![]() |
![]() |
||
Greenhouse Gas Emissions | Building Energy Use Intensity | Building Water Use Intensity | ||
Annual GHG emissions for the Pittsburgh campus & compared to other university peers | Building annual energy usage per square foot compared with national baselines & 2030 reduction goals | Building annual water usage per square foot compared with regional baselines & 2030 reduction goals | ||
|
|
|
||
![]() |
![]() |
![]() |
||
Compostable Collection | Food Systems Progress | Healthy Ride at Pitt Bike Share Utilization |
||
Campus-wide diversion of compostable materials monthly by building | Food recovery, Real Food Challenge, & dining hall food waste per guest | When & where the Pitt community takes advantage of our unlimited 30-minute bike share rides benefit | ||
|
Explore Food Systems Dashboard
|
Explore Bike Share Dashboard |
||
![]() |
||||
Diversity & Inclusion | ||||
Explore the Office of Equity, Diversity, & Inclusion’s dashboards |
View all dashboards on one page