
Nitrogen is one of the most common elements here on Earth. It’s presence in our atmosphere makes the sky blue, it helps make soils fertile for plants to grow and forms the foundations of proteins found in a healthy human body. However, excess nitrogen introduced into ecosystems in a reactive form is problematic.
Reactive nitrogen in the environment can have adverse effects on the environment and human health by causing smog, toxic algae blooms, acid rain, and biodiversity loss. Nitrogen is also a key contributor to climate change, when active nitrogen is exposed to soil (like in fertilizers) microbial reactions take place that generate nitrous oxide. Nitrous oxide has a warming potential 300 times greater than carbon dioxide as a greenhouse gas. Another primary way nitrogen is released is by combusting fossil fuels for heating and electrical generation.
A nitrogen inventory measures how much reactive nitrogen is released into the environment by an organization and can help identify ways to reduce nitrogen emissions. Pitt uses the Sustainability Indicator Management and Analysis Platform (SIMAP) to calculate its nitrogen footprint, which measures the amount of reactive nitrogen released to the environment from a campus’ resource consumption. Examples of reactive nitrogen include water pollutants nitrate and ammonium, air quality pollutants ammonia and nitrogen oxides, and the greenhouse gas nitrous oxide.
According to SIMAP, “Reactive nitrogen can result from everyday activities like food service, energy use, transportation, and ground fertilizer. Reducing your nitrogen footprint can provide benefits to air quality, water quality, and climate change.”
The University of Pittsburgh has been calculating and reporting on its nitrogen footprint since fiscal year 19 (FY19) as part of the annual greenhouse gas inventorying process. For FY23, Pitt’s net nitrogen footprint totaled 166.22 metric tons, a 27.57% increase from FY22. This is primarily due to a 43.3% increase in nitrogen from food which accounts for 51% of the Pittsburgh campus’s nitrogen, as shown in the graph below. This increase in food due to prior years being pandemic influence, FY23 was the first year where operations returned to a pre-pandemic level.
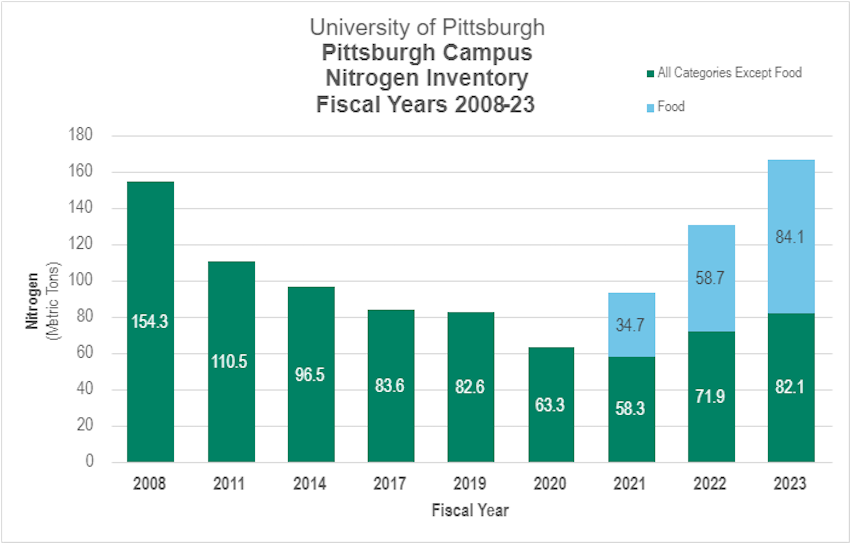
The second largest contributor to Pitt’s nitrogen is wastewater, which accounts for 24%. Compared to the 2008 baseline (which did not include food) FY23 nitrogen increased by 7.7%. However, when comparing all categories except food, campus nitrogen has decreased by 46.8% since FY08 and 0.6% since FY19.
How can you help reduce nitrogen emissions?
You can help advance multiple Pitt Sustainability Plan goals that help reduce nitrogen emissions by doing the following:
- Reduce your food waste by taking only what you can eat; arrange for food recovery at catered events.
- Eat a plant forward diet and make event catering all vegetarian or vegan.
- Reduce wastewater by saving water; turning off the faucet between uses and report leaks or running toilets to Facilities Management.
- If you live in a residence hall, you can reduce wastewater by taking shorter showers and only doing full loads of laundry.
Check out the full FY23 Nitrogen Inventory for the University’s Pittsburgh campus.
For comparison, check out Pitt’s FY22 Nitrogen Footprint.
All Pitt Nitrogen Inventories for the Pittsburgh campus are available under Commitments & Reports.