
The University of Pittsburgh’s 10th annual Greenhouse Gas Inventory shows a 37.3% drop in emissions since 2008, reaffirming Pitt’s progress toward its 2030 and 2037 climate goals.

Reflecting the University of Pittsburgh’s Climate Action Plan and commitment to achieve carbon neutrality by 2037, the results of Pitt’s Fiscal Year 2024 (FY24) Greenhouse Gas (GHG) Inventory for the Pittsburgh campus are summarized below. They showcase Pitt’s ongoing progress on GHG reductions and commitment to annual GHG inventories. The Pitt GHG Inventories represent a 15+ year collaboration between research, academics, and operations.
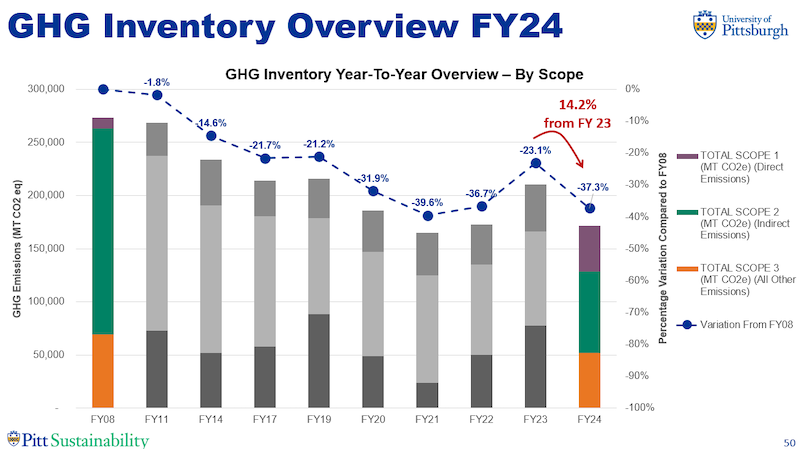
The University’s 10th GHG Inventory tallies Pitt’s Pittsburgh campus FY24 GHG emissions as 171,455 metric tons of carbon dioxide equivalents (CO2e). These results are 37.3% below our 2008 baseline, putting the University back on track to reach its 50% reduction target by 2030.
The full FY24 GHG Inventory report and Pitt Sustainability GHG dashboard detail and showcase how Pitt has tracked and reduced its carbon emissions over time, in line with international protocols and best practices.
As Pitt actively works towards carbon neutrality by 2037 (while hitting the incremental target of 50% reduction in GHG emissions below 2008 levels by 2030), key takeaways from the FY24 University of Pittsburgh GHG Inventory for the Pittsburgh campus include:
Overall – For FY24, 171,455 metric tons of carbon dioxide equivalents were associated with the University’s Pittsburgh campus, 37.3% below the FY08 baseline. However, FY24 GHG emissions were 20% lower than FY19 (the last pre-pandemic-influenced GHG inventory year). They were also 14% lower than FY23, mostly due to a data error relating to Scope 3 (travel) GHG emissions.
The Pittsburgh campus population is continuing to grow, with FY24 seeing a 10% population growth (employees + students). Building square footage in the GHG boundary decreased slightly, but is expected to continue to increase through at least fiscal year 2027.
The top 3 GHG emissions sources for FY24 remained electricity, steam, and air travel. Beyond travel decreases, GHG emissions reductions are attributable to increased renewable electricity procurement and reduced steam consumption (due to fewer heating degree days). GHG emissions due to natural gas in buildings, student commuting, and refrigerants, and fertilizers were notably up.
Scope 1 Emissions
Steam – The second largest contribution to FY24 GHG emissions was from steam, which contributed 26% of total emissions; steam is primarily used for heating and both generated on-campus and purchased (Scope 1 and 2, respectively),
- Natural Gas For Buildings – Despite a slight decrease in square footage, natural gas use in buildings was markedly up, with 25% growth in the category (which is only 5.9% of total emissions).
- Fleet Vehicles – While fleet GHG emissions are 26% lower than FY19, reduction has stagnated, keeping the University off track to meet its goal of reducing GHG emissions in this category 50% by 2030 (below 2017 baseline).
- Refrigerants – In FY24, Pitt used a total of 4,290 pounds of refrigerants, which translates to 3,272 MT CO2e (2% of total FY24 GHG emissions). This relatively high use is attributable to two large maintenance projects on older equipment requiring higher global warming potential refrigerants.
Scope 2 Emissions
- Electricity – Purchased electricity remains the largest contributor to Pitt’s overall GHG emissions (36% of all FY24 emissions).
- FY24 GHG emissions from purchased electricity were down 56% compared to FY08, and down 17% from FY19; these reductions are due to both the University’s renewable electricity procurement and a regional shift toward lower carbon sources (i.e., reductions in electricity produced by coal coinciding with increases in electricity generated from nuclear, natural gas, and renewable sources).
- Renewables – For FY24, 33.5% of Pitt’s annual electricity consumption was attributed to renewables (double FY23); the University remains on track to reach its renewable electricity goals of 50% by 2030 and 100% by 2037.
- Electricity Consumption – Total campus-wide electricity usage in FY24 was 7% lower than FY19, but 3.3% higher than FY23.
Scope 3 Emissions
Travel – The largest decrease between FY23 and FY24 GHG emissions was from Scope 3 air and ground travel emissions, which decreased 33% compared to FY23, in part due to a data collection error. Pitt’s Scope 3 GHG emissions are also 41% lower than FY19.
- Commuting – Commuting was Pitt’s fourth largest GHG emissions contributor in FY24, with GHG emissions from commuting DOWN 2% compared to FY23, and remain 65% lower than FY19. This sustained reduction in commuting emissions post-pandemic reflects avoided commutes from hybrid work schedules, an increase in active commuting, and an increase in on-road electric vehicles.
- Food –– Reflecting Pitt’s commitment to the Coolfood Pledge, food-related GHG emissions were added to GHG inventory process in FY21; this category was up 2% in FY24, reflecting more on-campus food consumption via dining halls, Pitt Eats retail locations, and catering.
In line with Pitt’s commitment to carbon neutrality for the Pittsburgh campus by 2037, Pitt GHG Inventories are completed annually — and the GHG inventory process has already started for the FY25 inventory. The campus-wide process is guided by Dr. Melissa Bilec, Co-Director of the Mascaro Center for Sustainable Innovation, and Dr. Aurora Sharrard, Assistant Vice Chancellor for Sustainability.
The FY24 Pitt GHG Inventory was completed by Federica Gerimicca and Isabella Cicco (both doctoral students in Civil & Environmental Engineering), with data provided from offices and departments across the University. The reports serve as guidelines for the Chancellor’s Advisory Council on Sustainability, its Carbon Commitment Committee (which has already reviewed the results), and other committees, groups, and individuals working to reduce Pitt’s GHG emissions.
If your office, department, or group would like a presentation on the findings, please email sustainability@pitt.edu.